Physical Science
MET 1010 - Intro to Meteorology-Assignment 2
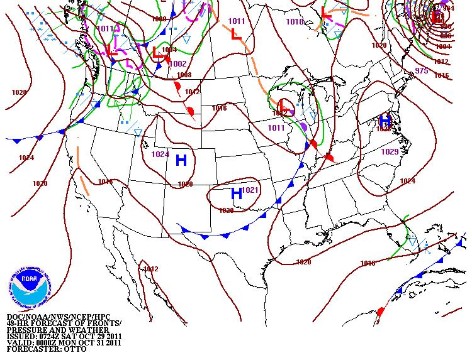
Weather Forecasting - Finding a Mid-latitude Cyclone
48-Hour Forecast Date and Time: October 31, 2011 0724Z City and State: Champaign, Illinois 4-Letter Station Identifier: KCMI
 METAR DATA The Metar Data does indicate mist but not a significant amount. This does not support the forecast.
METAR text: KCMI 310753Z AUTO 21006KT 6SM BR BKN080 04/04 A3001 RMK AO2 SLP165 T00440044$ Conditions: KCMI(CHAMPAIGN/URBANA, IL, US) observed 0753 UTC 31 October 2011 Temperature: 4.4oC(40oF) Dewpoint : 4.4oC(40oF) [RH=100%] Pressure 30.01 inches Hg (1016.3 mb) (altimeter): [Sea-level pressure: 1016.5 mb] Winds: from the SSW (210 degrees) at 7 MPH (6 knots;3.1 m/s) Visibility: 6 miles (10 km) Ceiling: 8000 feet AGL Clouds: broken clouds at 8000 feet AGL Weather: BR (mist) “$” is an indication the sensor requires maintenance
| Infrared Imagery The satellite infrared imagery shows a front indicating air masses of different densities moving parallel. This is a characterization of a mid-latitute cyclone. 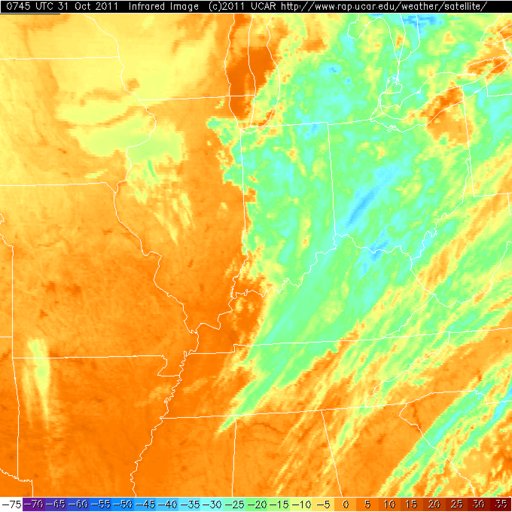 Doppler Radar The Doppler Radar shows moisture and activity over Illinois which could also indicate that a mid-latitude cydone is indicated. 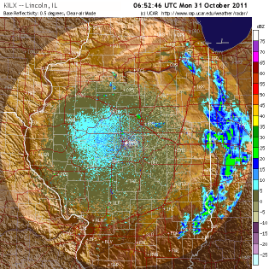 |
Reflection: I learned to identify a cold front on a weather map as the blue line with blue triangles protruding. I can also identify the cold weather patterns on infrared imagery. The thing I am most fascinated by is the Doppler Radar. I think it is amazing to actually identify storms as they travel by. Now that I am familiar with this information I can see what cold temperatures and storms are headed our way.